
Our biggest update yet has arrived! Introducing the all-new Dashboard feature for Site Diary.
Designed to give construction teams instant visibility into project performance, the new Dashboard helps users track progress, monitor resources, analyse costs, and identify potential issues before they become costly problems.
By bringing key project information together in one place, Site Diary enables project managers, supervisors, and stakeholders to make faster, more informed decisions based on real-time data.
Furthermore, the Dashboard promotes transparency, improves collaboration, and helps teams stay aligned throughout every stage of a project. Users can filter individual dashboards or apply a global date filter to analyse activity across specific time periods.
Site Diary Dashboard Features
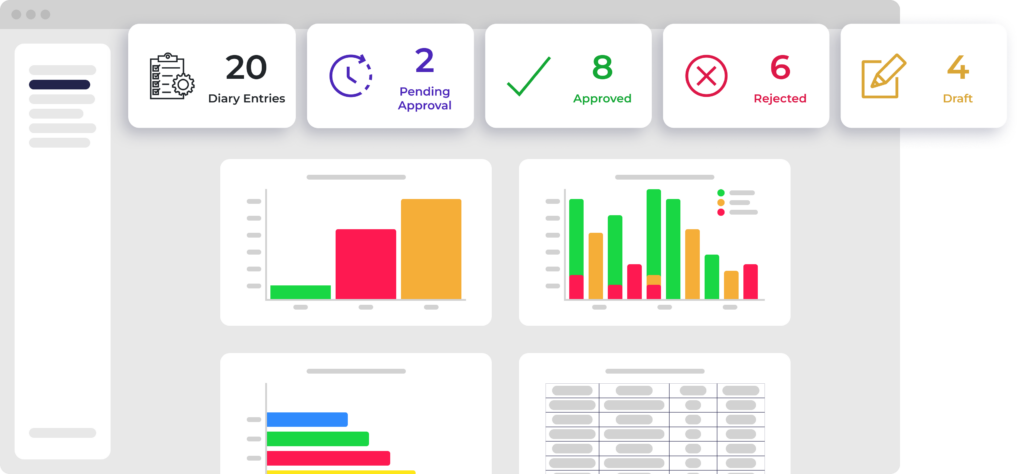
The Site Diary Dashboard includes a range of powerful reporting and analytics tools designed to provide greater visibility into site activity.
Count by Date and Status
Monitor the progress of diary events over time by viewing entries according to their creation date and current status. This helps teams quickly understand project activity and identify trends.
Created By
See a breakdown of diary events by user. This provides a clear overview of team activity and reporting contributions across the project.
Average Total Manhours
Track the total hours recorded within diary events. Site Diary automatically calculates average manhours based on the personnel entered into each event, giving project managers greater visibility over workforce allocation.
Resources
Analyse how resources are being used across your projects, including:
- People
- Equipment
- Materials
As a result, managers can identify utilisation patterns and make better resource-planning decisions.
Information
Gain deeper insights into project data by analysing information linked to diary events, including:
- Tags
- Contractors
- Locations
This makes it easier to identify recurring trends, monitor activity, and generate meaningful project reports.
Cost (People)
Monitor labour-related costs and gain greater control over personnel expenditure across your projects.
Cost (Equipment)
Track equipment costs in real time and identify opportunities to improve cost efficiency throughout the project lifecycle.
How to Access the Dashboard
Dashboards can be accessed at both organisation and site level.
At an organisation level, Dashboards are available within the Administration section of the web application. This feature is available to users with Admin permissions.
At site level, access depends on user roles:
Administrators
- Full access to all Dashboard features
Supervisors
- Full access to all Dashboard features
Viewers
Access to:
- Count by Date and Status
- Created By
- Average Total Manhours
- Resources (People, Equipment, Materials)
- Information (Tags, Contractors, Locations)
Members
- No Dashboard access
Why Use the Site Diary Dashboard?
Construction projects generate large amounts of data every day. However, without the right tools, turning that data into actionable insights can be difficult.
The Site Diary Dashboard transforms site information into clear visual reports that help teams:
- Track project progress in real time
- Monitor resource allocation
- Control labour and equipment costs
- Improve decision-making
- Increase visibility across projects
- Identify trends and potential issues earlier
- Improve collaboration between site and office teams
Consequently, project managers spend less time searching for information and more time delivering successful projects.

